

Bewerbungen an:
jobs@greenpocket.de +49 (221) 355095-29
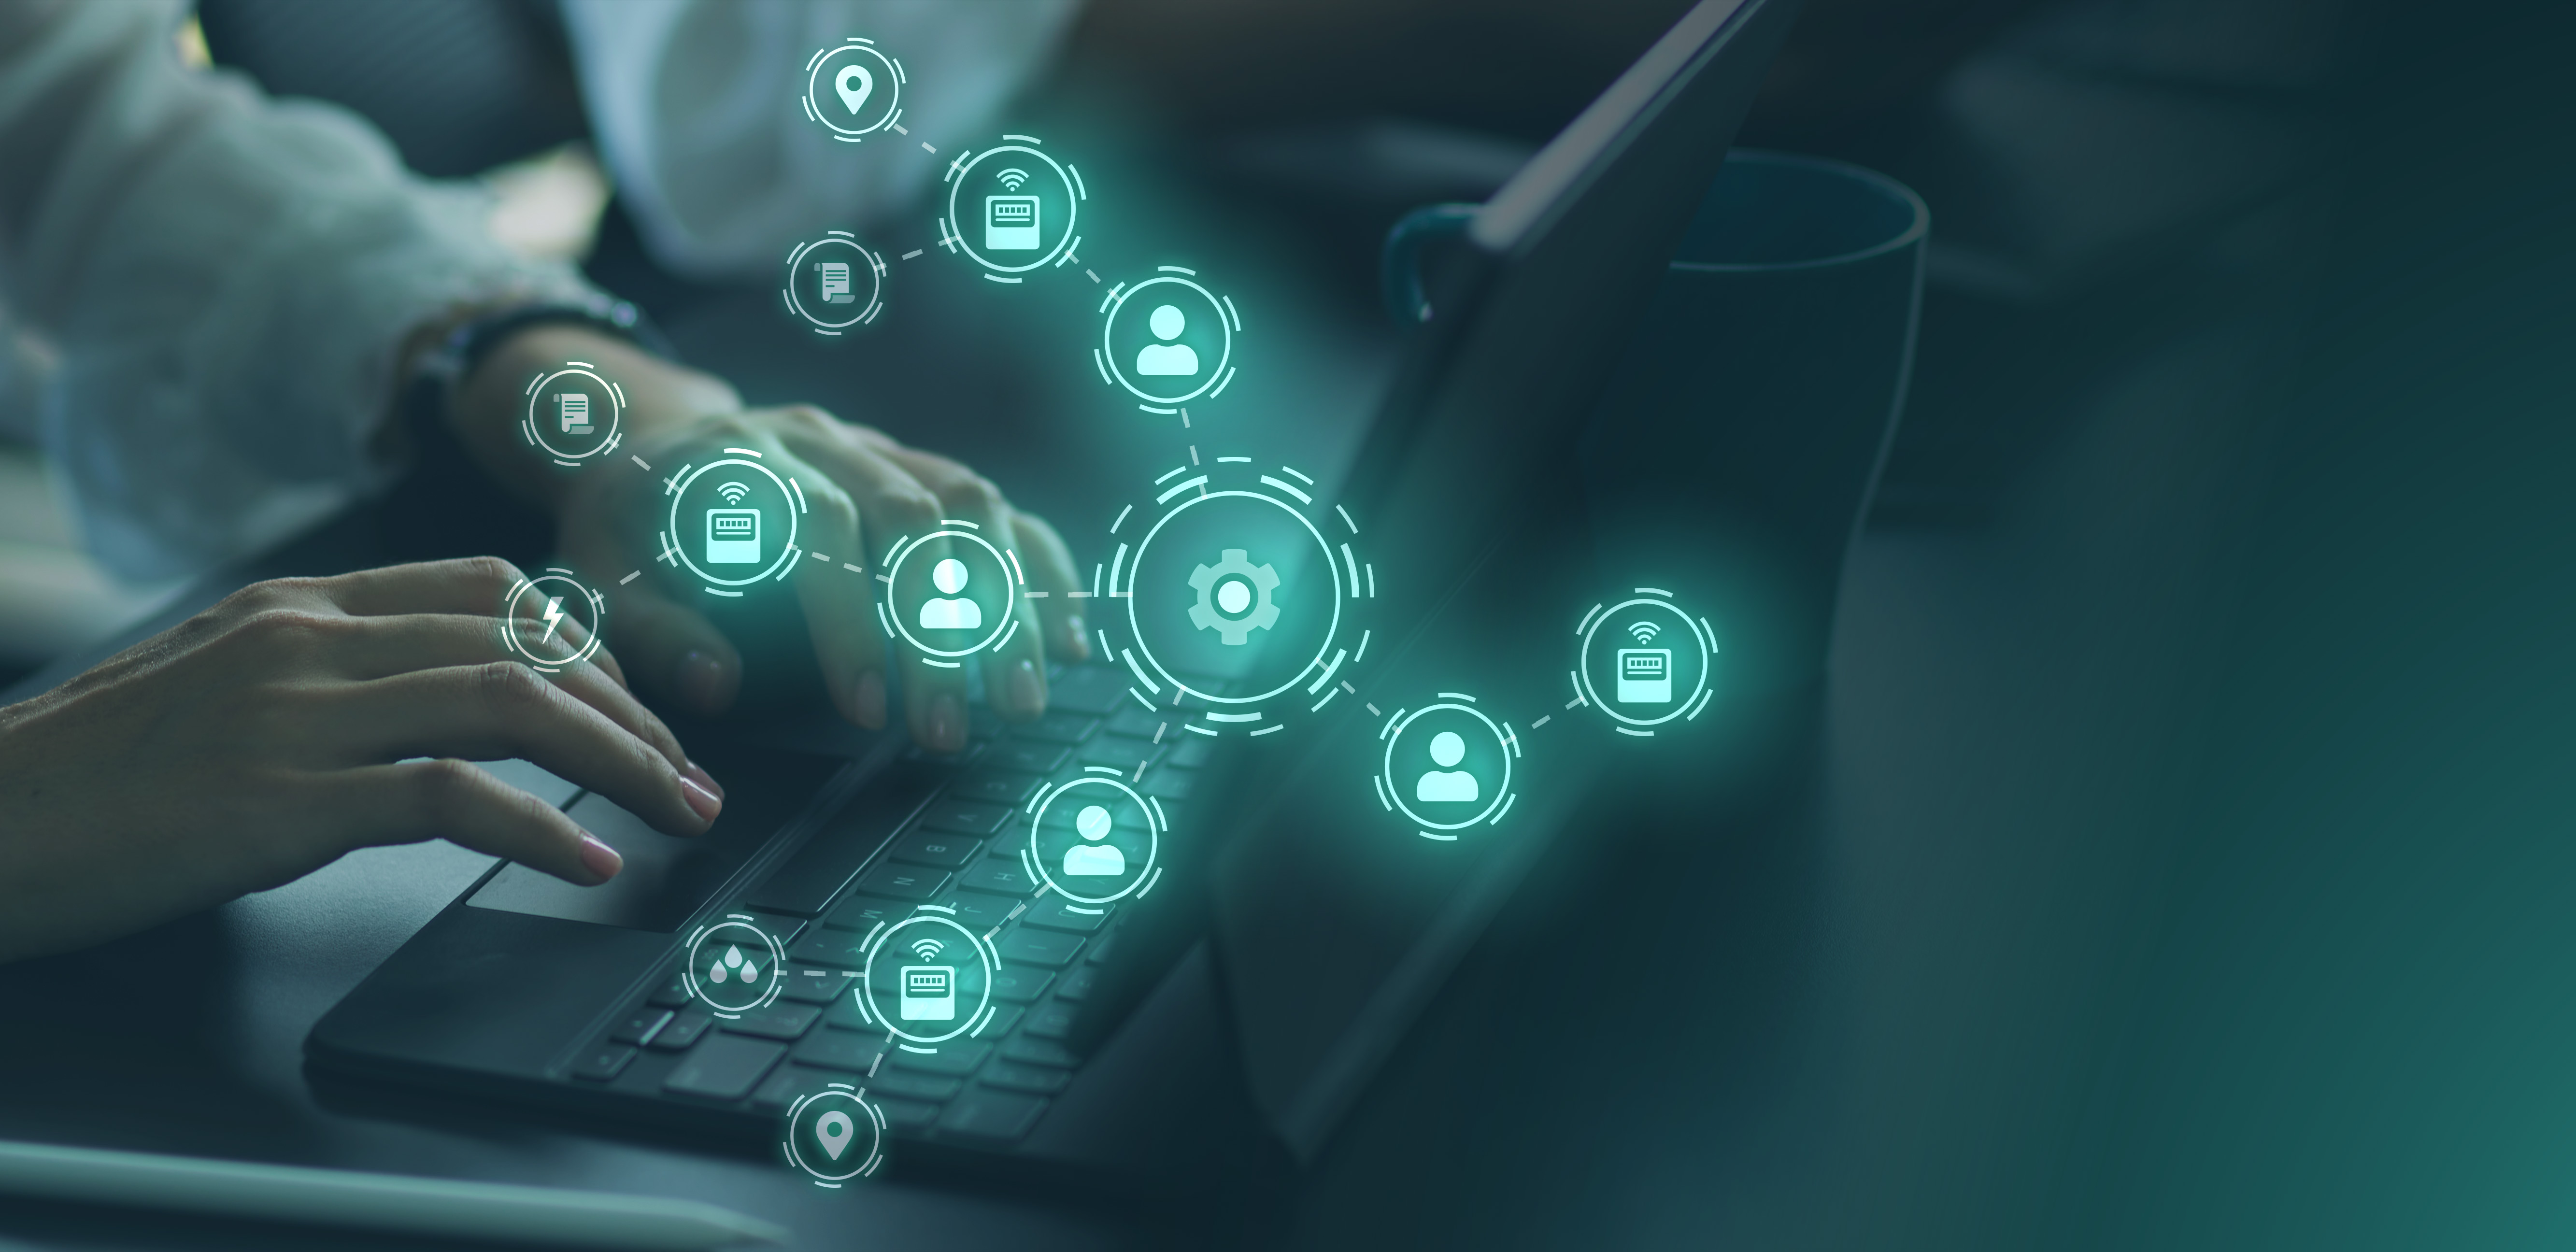
Modern energy management no longer begins with looking at individual consumption figures. Today, digitalization gives us the opportunity to understand buildings and systems more deeply than ever before. Data makes transparent what used to remain hidden: energy flows, interrelationships, inefficiencies. Everything can be made visible and thus specifically improved. Estimates are replaced by a clear, data-based understanding of reality. This is exactly where the digital twin comes into play, a central concept of digitalization that is also becoming increasingly important in energy management, as it allows for the realistic digital representation of real buildings, measurement objects, etc.
The digital twin opens up a multitude of advantages, especially in energy management, infrastructure planning, and plant operation. It forms the foundation for mapping companies hierarchically and arranging measurement objects with unlimited depth. By connecting to reality via sensors and data sources, it creates the basis for monitoring, simulating, and analyzing data in real time, thereby providing a deep understanding of the condition, behavior, and optimization potential of a measurement object. Inefficient processes or faulty components can thus be quickly identified and, based on this, informed decisions can be made to increase energy efficiency, reduce operating costs, and achieve sustainability goals.
The digital twin bridges the gap between the physical and digital worlds. It translates complex structures into comprehensible information, provides a transparent overview and deep insights into systems, and enables informed optimization, whether in real estate, renewable energies, or industrial applications.
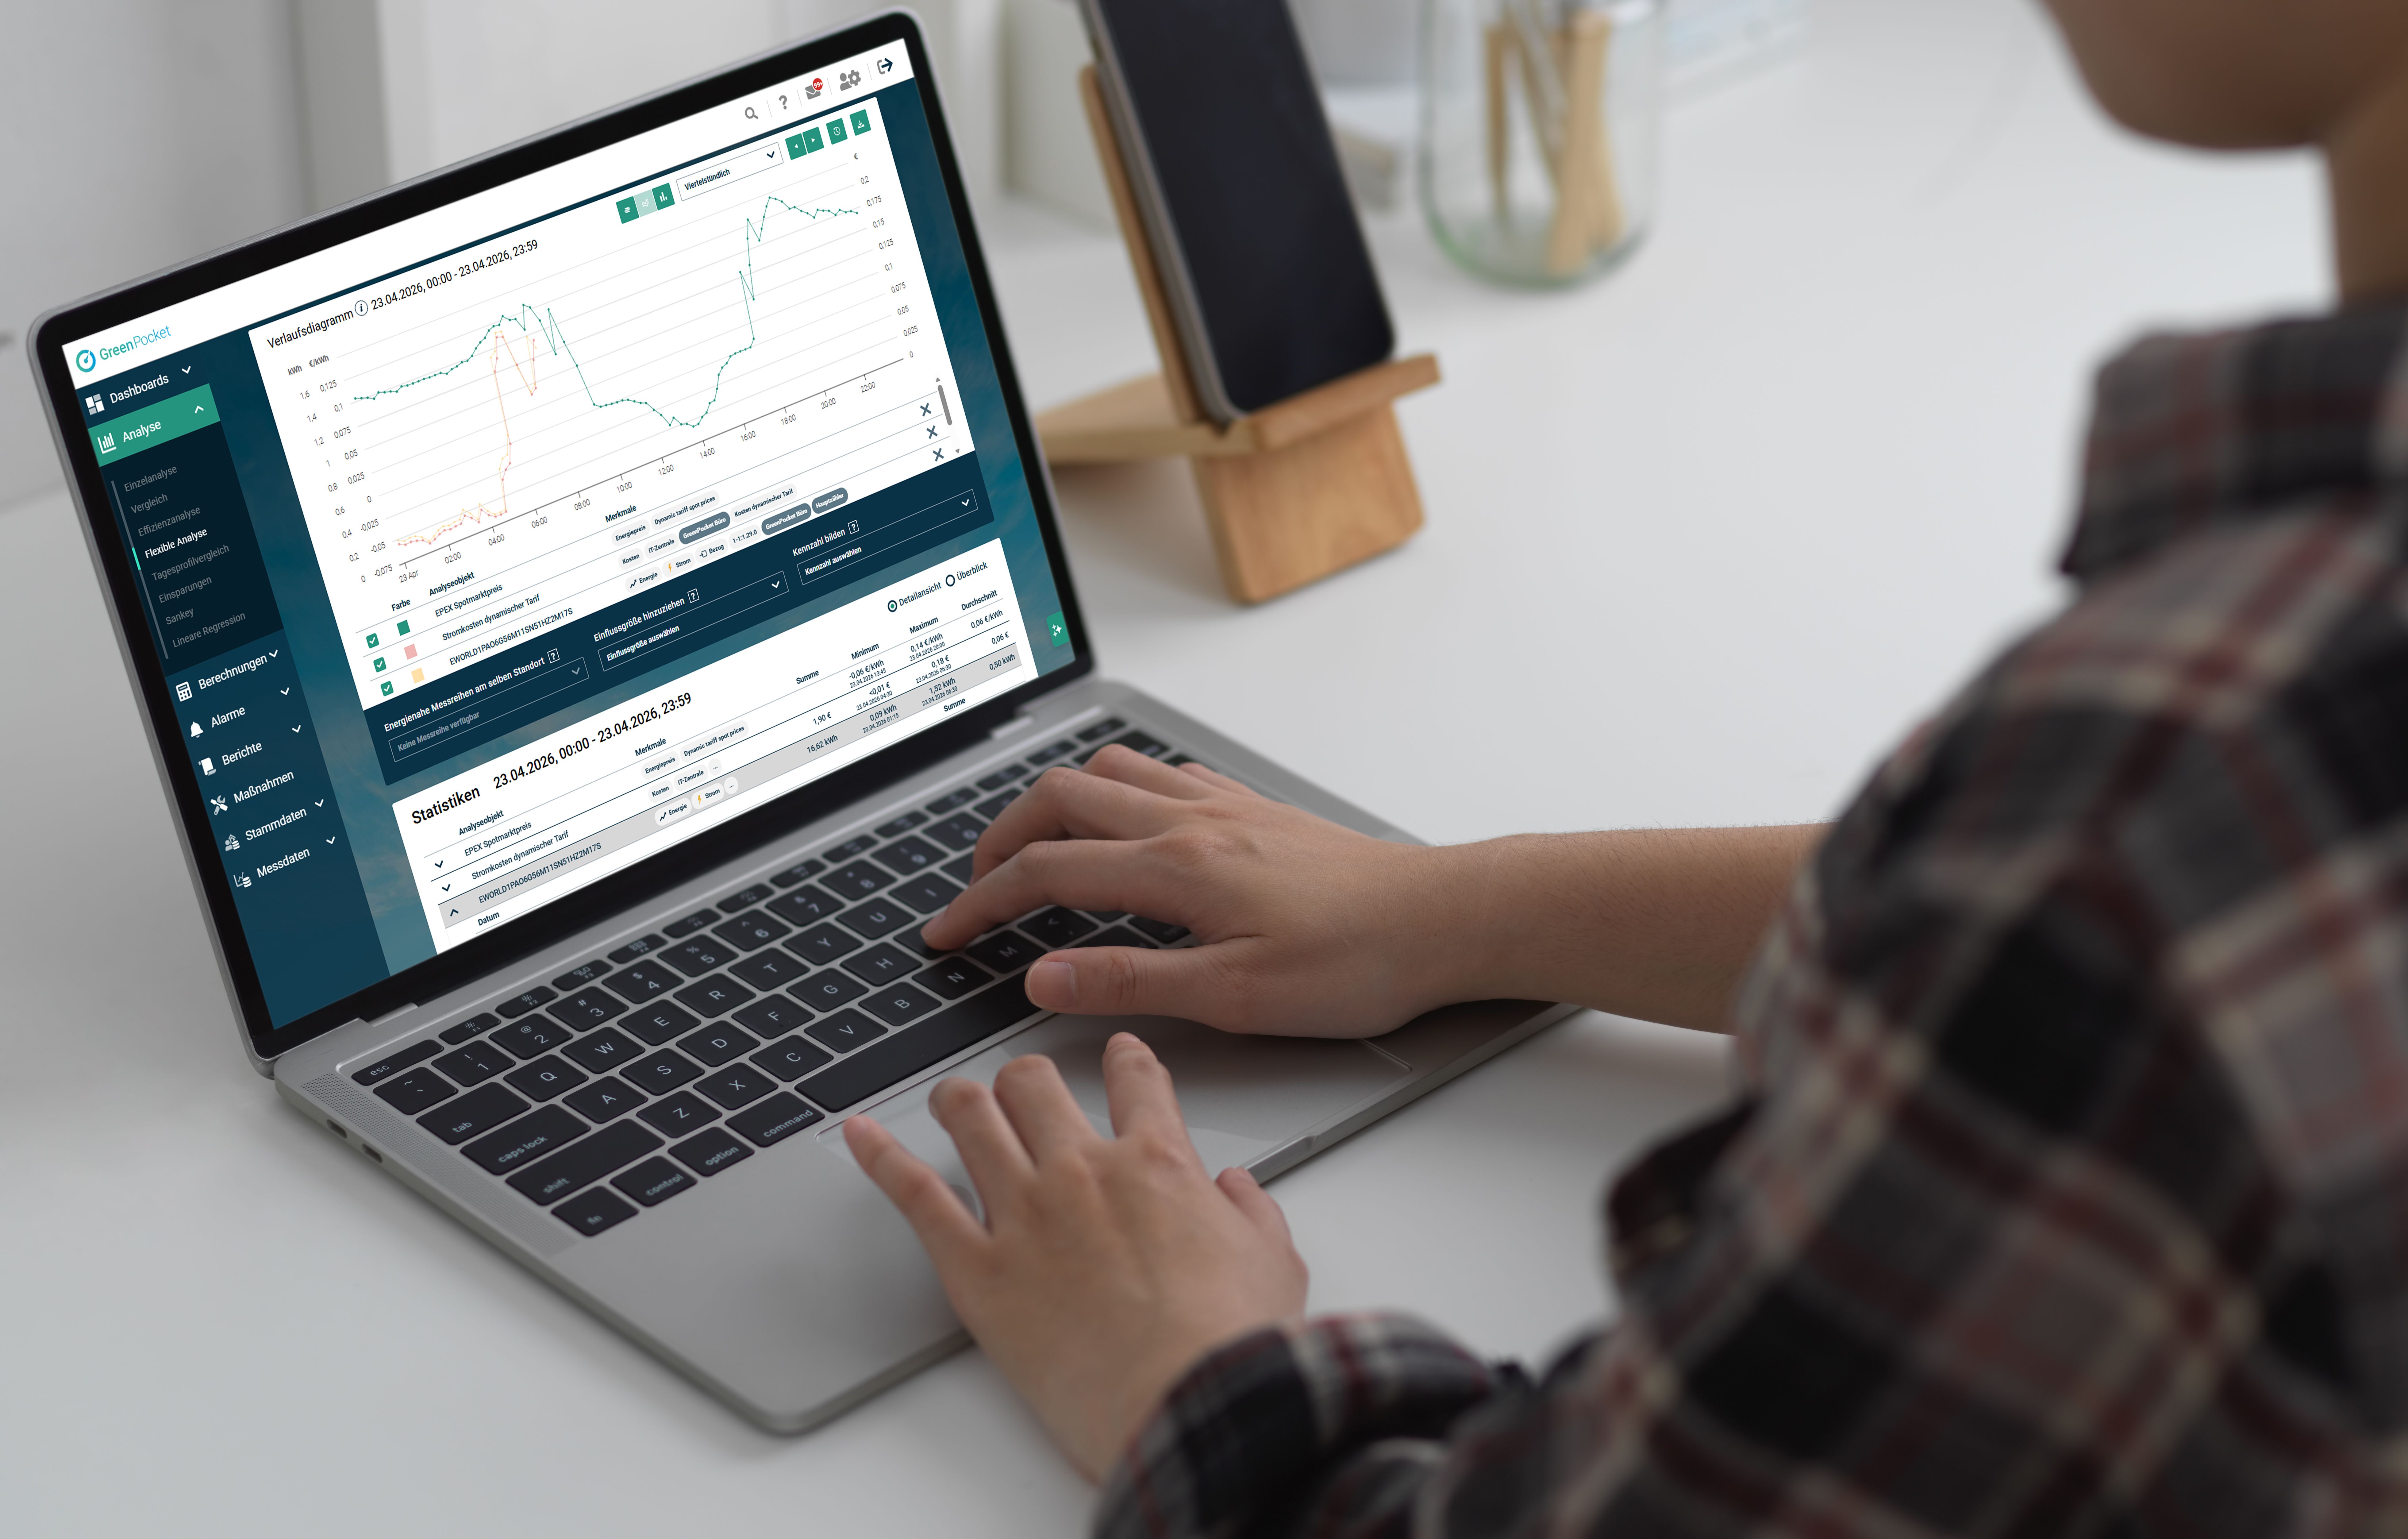
The advantages are obvious: greater transparency, better decisions, higher efficiency. To enable you to realize these added benefits directly in your company, we have expanded our energy management software with this new feature. This powerful tool maps your locations, systems, and devices more realistically than ever before, laying the foundation for more precise analyses, more efficient control, and customized energy optimization.
It was important to us to prepare the data in such a way that it is understandable and easily accessible not only to experts in energy management, but also to anyone without specialist knowledge. To facilitate evaluation, comparative values are visually presented and color-coded in the software. This makes correlations, differences, and trends recognizable and comprehensible at a glance. In order to provide an optimal solution for all individual use cases, information and requirements from a wide range of sectors, such as industry, hospitals, and the public sector, were considered during development.
Categorizing measurement objects allows them to be compared, which creates enormous data quality. Variables for this categorization can include size or type of use. This allows measurement objects in the same category, such as charging stations, PV systems, or buildings, to be compared with each other and their consumption, generation output, and efficiency to be analyzed. This is a real game changer, especially for companies that want to intelligently control their energy and data flows.
Formulas provided in the software enable the automatic calculation of a wide variety of key values, from the analysis of which valuable insights can be gained. A typical use case: Looking at an area with charging stations, the evaluation of charging times and frequencies allows conclusions to be drawn about usage efficiency and targeted measures for expansion planning to be derived. In this way, raw data is transformed into knowledge and real added value.
The digital twin not only maps standard objects, but also allows you to map your individual measurement concept and enables the display, analysis, and billing of measurements and data of all kinds. This opens up a wide range of possible applications, for example:
• PV system controlling
• Charging station management
• Renewables & KPI dashboards
• and many other specific use cases in your company
With your data, we can develop dashboards customized specifically to your use case.
The digital twin provides a visual, structured, and intelligent representation of your entire company—down to the last detail.
• Realistic digital representation of all relevant systems, devices, and processes with individual characteristics
• Intuitive orientation and operation thanks to simplified navigation and filtering options
• Direct comparability of measurement objects for informed decisions in energy management
This allows you to maintain an overview at all times – from individual meters to the entire site. The digital twin precisely assigns each object to the existing hierarchy of your infrastructure and displays its individual properties. The result: intuitive and efficient work, whether for analysis or optimization.
It combines clarity with intelligent functionality. This will enable you to take the next step toward data-driven, efficient energy management.
Feel free to contact us and unleash the full potential of your energy data with us.