


Bewerbungen an:
jobs@greenpocket.de +49 (221) 355095-29
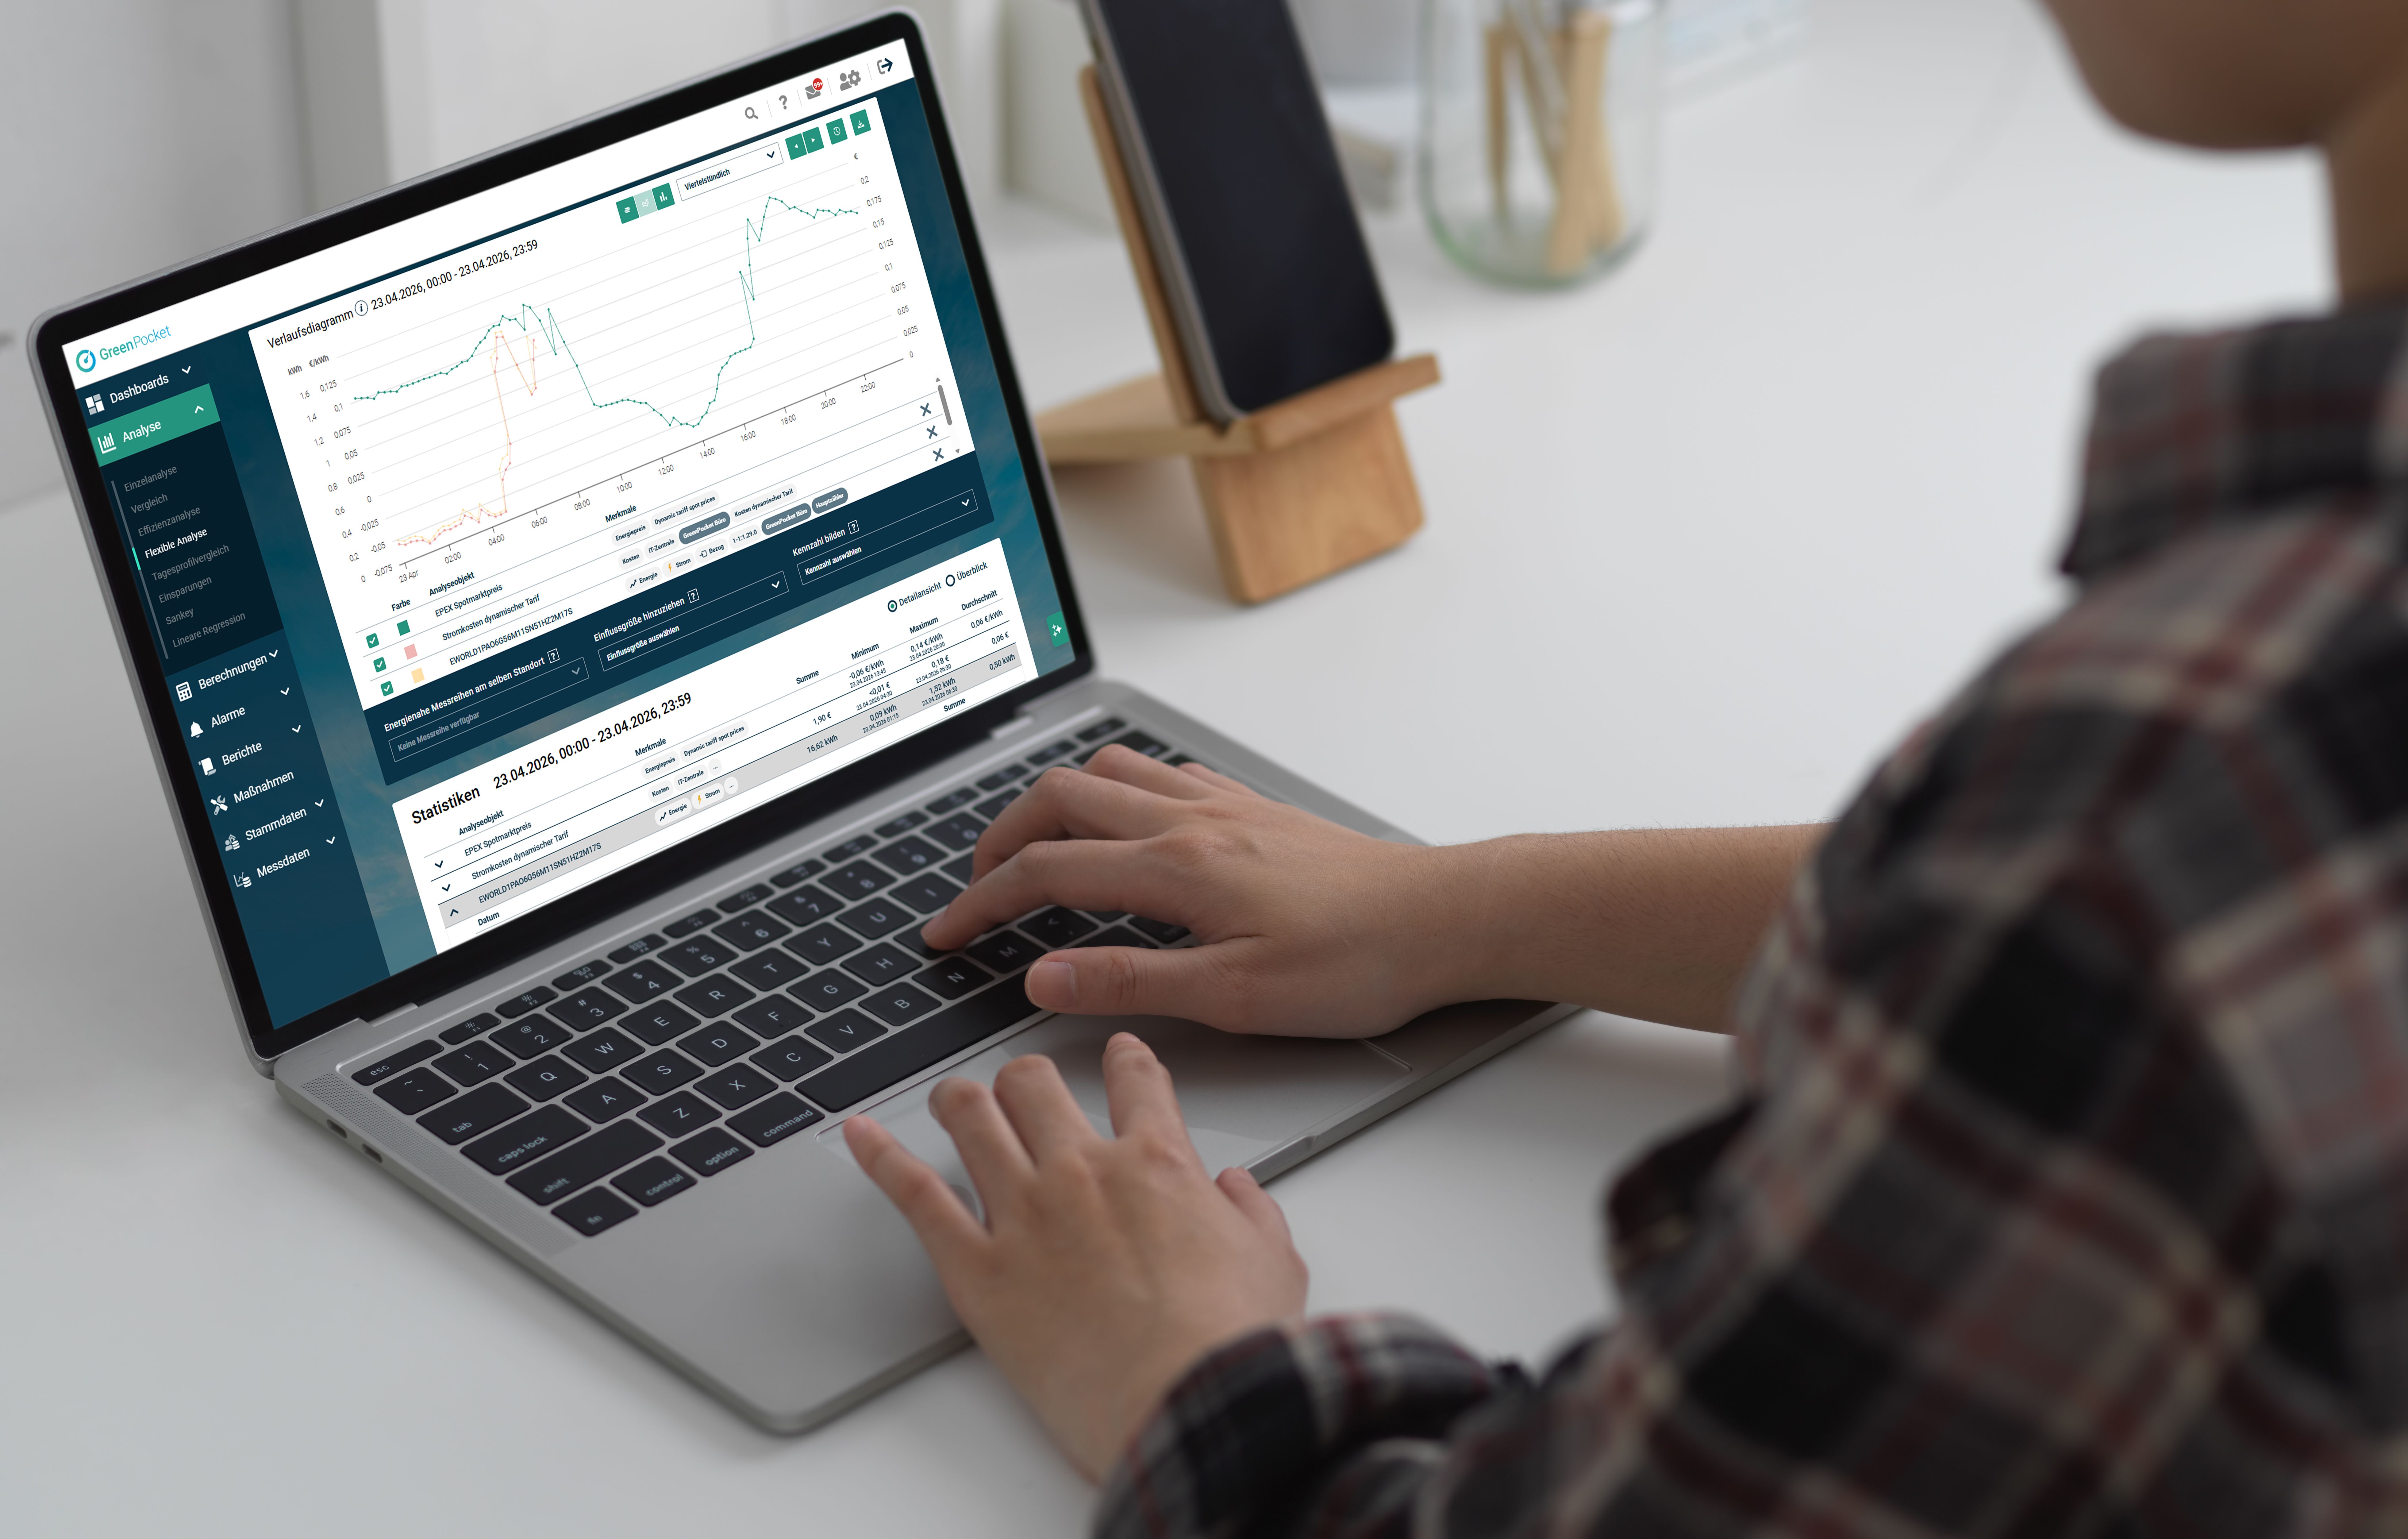
The newly developed company view dashboard now creates even more transparency in your energy management and provides a central overview of all relevant company data. As part of the further development of our energy management platform, we enable precise analysis and visualization of energy data with the digital twin and flexibly configurable dashboard templates - individually adaptable for every use case.
The company view dashboard complements the existing “Overview”, "Generation" and “Map” dashboards and provides a holistic view of all your company's energy data - from a general overview to a detailed analysis of individual locations and measuring points.
This allows you to find all relevant company data in one place! Energy consumption at individual locations can be visualized and compared with just a few clicks. You can jump directly from the dashboard to the detailed view of individual meter points and go into more in-depth analyses, ideal for efficient energy controlling A detailed hierarchy tree makes navigation easier, while a powerful search function simplifies object selection, even with large amounts of data. Tool tips provide context-related information directly in the dashboard. Particularly helpful: deviations are automatically highlighted in color so that optimization potential and anomalies can be identified immediately. At the same time, all visualizations and meter readings can be exported in various formats with just a few clicks, ideal for internal evaluations or external reports.
As part of the further development of our energy management platform, we have made the master and measurement data more flexible, enabling measurements and data of all kinds to be displayed and calculated. Thanks to the digital twin, each property with its individual properties can be identified and analyzed. We have thus created the basis for customized energy transition dashboards that are precisely tailored to your personal use case.
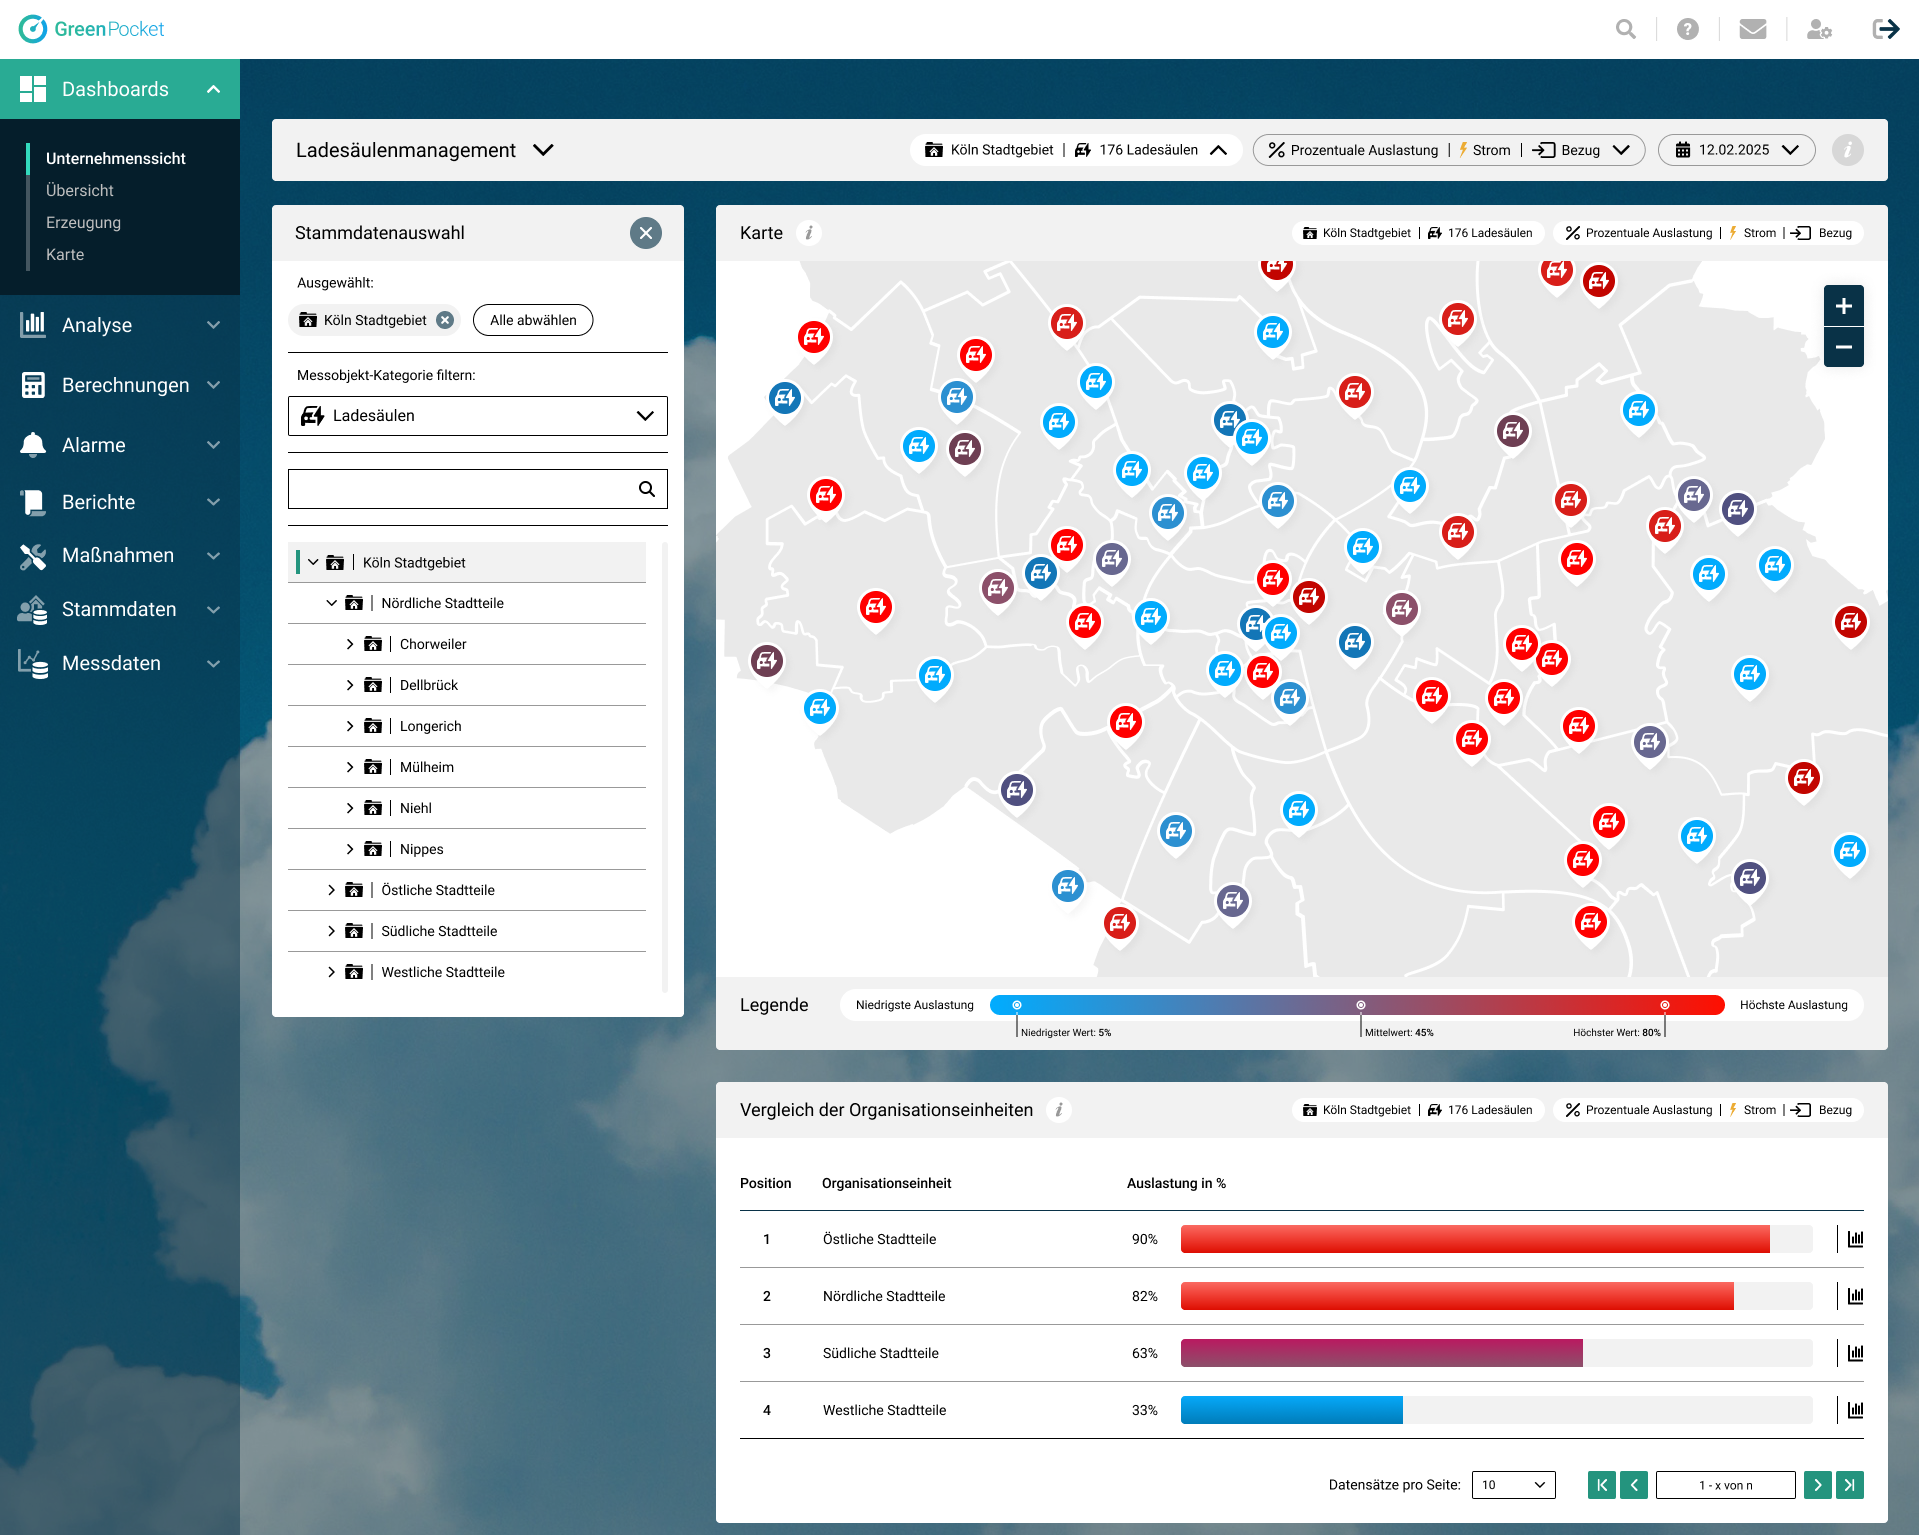
Such dashboards can look like this:
With the new energy transition dashboards, charging station management can be optimized and the entire portfolio of charging stations can be visualized at a glance. The charging stations can be colored according to the KPI of your choice, while a ranking highlights the most relevant districts, locations or charging stations. This allows hotspots, outliers and defective objects to be identified immediately. Switching from the overall view to the details of individual charging stations is intuitive and immediately provides all associated measured values.

The generation of renewable energy can also be presented clearly and effectively to the public in future. The dashboard provides an overview of renewable energy generation in the entire city area, offers the option of filtering by type and district and provides a differentiated display depending on the type of system. An integrated ranking highlights the most relevant energy sources and districts so that trends and potentials can be quickly identified.


The PV system controlling dashboard provides an overview of all PV systems in the city. Based on weather data, target generation values are calculated and highlighted in color so that deviations from actual generation are immediately visible. This makes it possible to quickly derive necessary measures such as repairs or cleaning of the systems and thus reduce losses through rapid recommissioning. The detailed view, which can be called up with just a few clicks, provides insights into individual PV systems so that actual and target values are transparent and easy to understand.


GreenPocket provides you with individually configurable dashboards, developed on the basis of your data and your specific needs. The optimized overview enables a quick jump to the detailed view and helps to detect anomalies at an early stage. This not only makes your energy management more transparent, but also more efficient and future-proof.
Interested? Feel free to contact us and help us shape the future of your energy data.